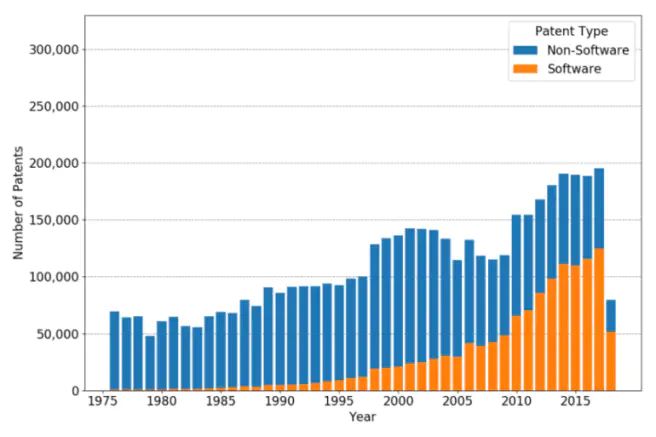
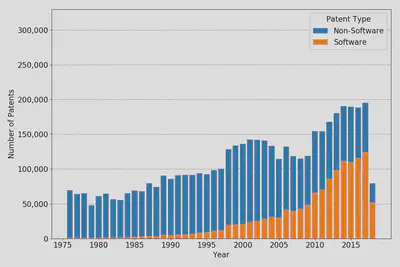
 Absolute numbers of software patents vs. non-software patents.
In 2015, I wrote my Bachelor’s thesis on identifying software patents. This is useful and necessary in two ways. First, there is no official system to sort patents this way. The main system used by the USPTO focuses on the technological and functional form. A subclass dealing with dispensing solids contains manure spreaders and toothpaste tubes. In contrast, researchers are more interested in topics like automation or software. Second, I learned Python and made my first steps into the world of machine learning.
You can find the whole project on Github as well as the paper. There is also a script to download different kinds of data sets. The raw data uses approximately 90GB of disk space whereas the data for replicating the previous results based on a simple algorithm is currently less than 1GB.
Now, let us see what has been done so far.
The idea of the project is based on an algorithmic approach of Bessen & Hunt (2007). The authors wanted to estimate the number of software patents and find out where software patents are used and what economic indicators are correlated with having more software patents.
To classify patents into categories of software and non-software, the authors developed a simple algorithm based on the evaluation of a random sample of patents. The algorithm is as follows:
(("software" in specification)
 OR ("computer" AND "program" in specification))

AND (utility patent excluding reissues)

ANDNOT ("chip"
        OR "semiconductor"
        OR "bus"
        OR "circuit"
        OR "circuitry"
        in title)

ANDNOT ("antigen" OR "antigenic" OR "chromatography" in specification)
According to Bessen & Hunt (2007), the specification is the abstract and the description of the patent. Note that, PatentsView separates description into two parts, summary and description.
To replicate the algorithm, the project relies on two strategies. The first data source is Google Patents where the texts can be crawled. As this procedure is not feasible for the whole corpus of patents, the second data source is PatentsView which provides large data files for all patents from 1976 on.
The replication of the original algorithm succeeds in 398 of 400 cases as one patent was retracted and in one case an indicator was overlooked which lead to an error in the classification.
Compared to the manual classification of the authors, the algorithm performed in the following way:
| Relevant | Not Relevant | |
|---|---|---|
| Retrieved | 42 | 8 |
| Not Retrieved | 12 | 337 |
Relevant refers to software patents according to the manual classification whereas retrieved indicates software patents detected by the algorithm. The upper left corner can also be called true-positives whereas the lower right corner shows the number of true-negatives.
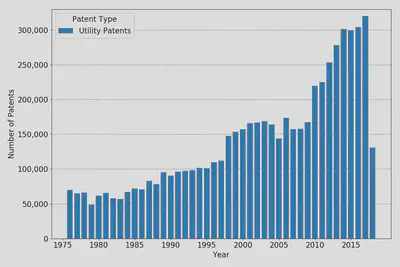
Applying the algorithm to the whole patent corpus, we get the following distributions of patents and software versus non-software patents.
Tobias Raabe
I am a data scientist and programmer living in Hamburg.